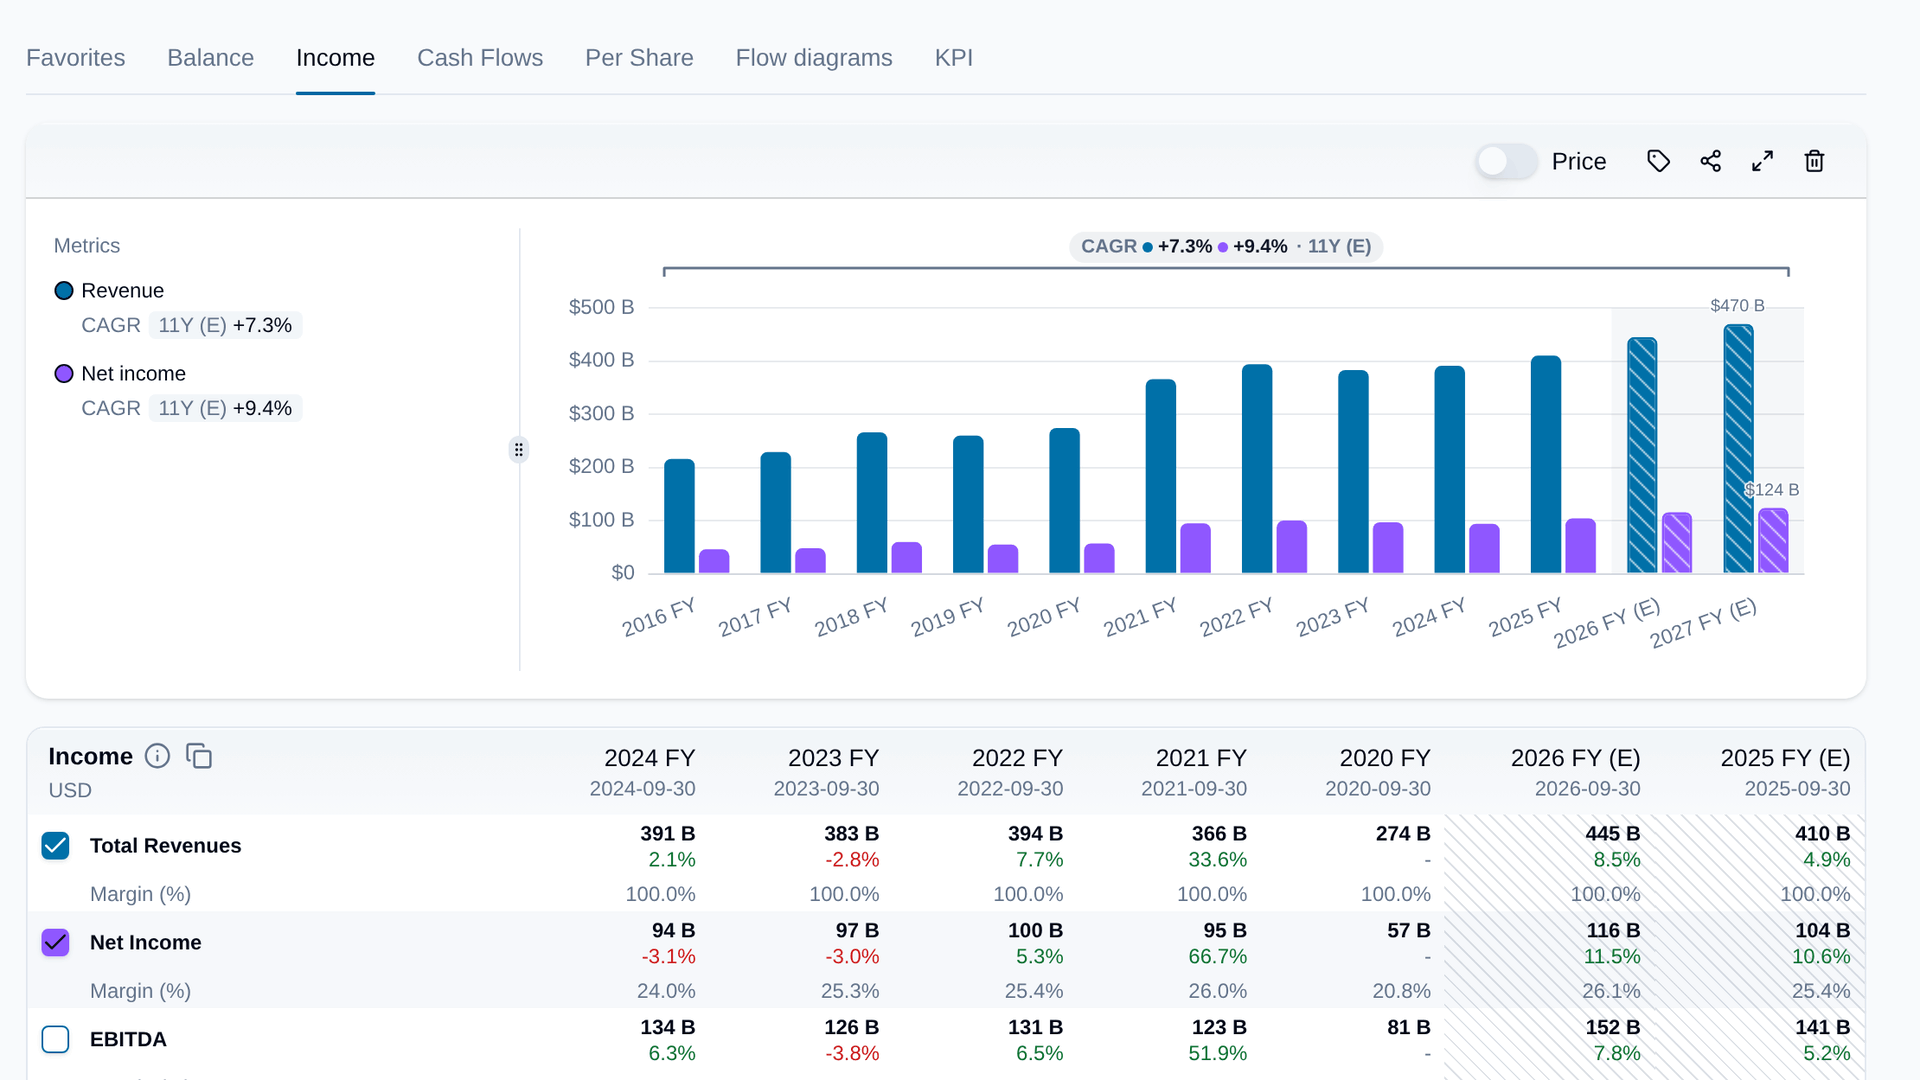
The financial charts on a stock page say how fast something grew without making you work it out. A bracket sits above the bars, from the first year to the latest, with the compound annual growth rate on top. Chart two, three or four lines and the bracket carries one figure for each, marked with its colour.
Drag across the bars and the bracket moves onto the stretch you picked, with the growth rate for just those years. Click anywhere or press Escape and it goes back to the whole period.
Trend lines no longer cover the chart all at once. Point at a series, or its row in the legend, and its trend line appears with its growth rate. Pin the ones you want to keep from the legend.
Every report chart also has a Share button. It redraws the chart on a card with your choice of background, light or dark, and a 16:9, square or 4:5 frame, ready to download and post.