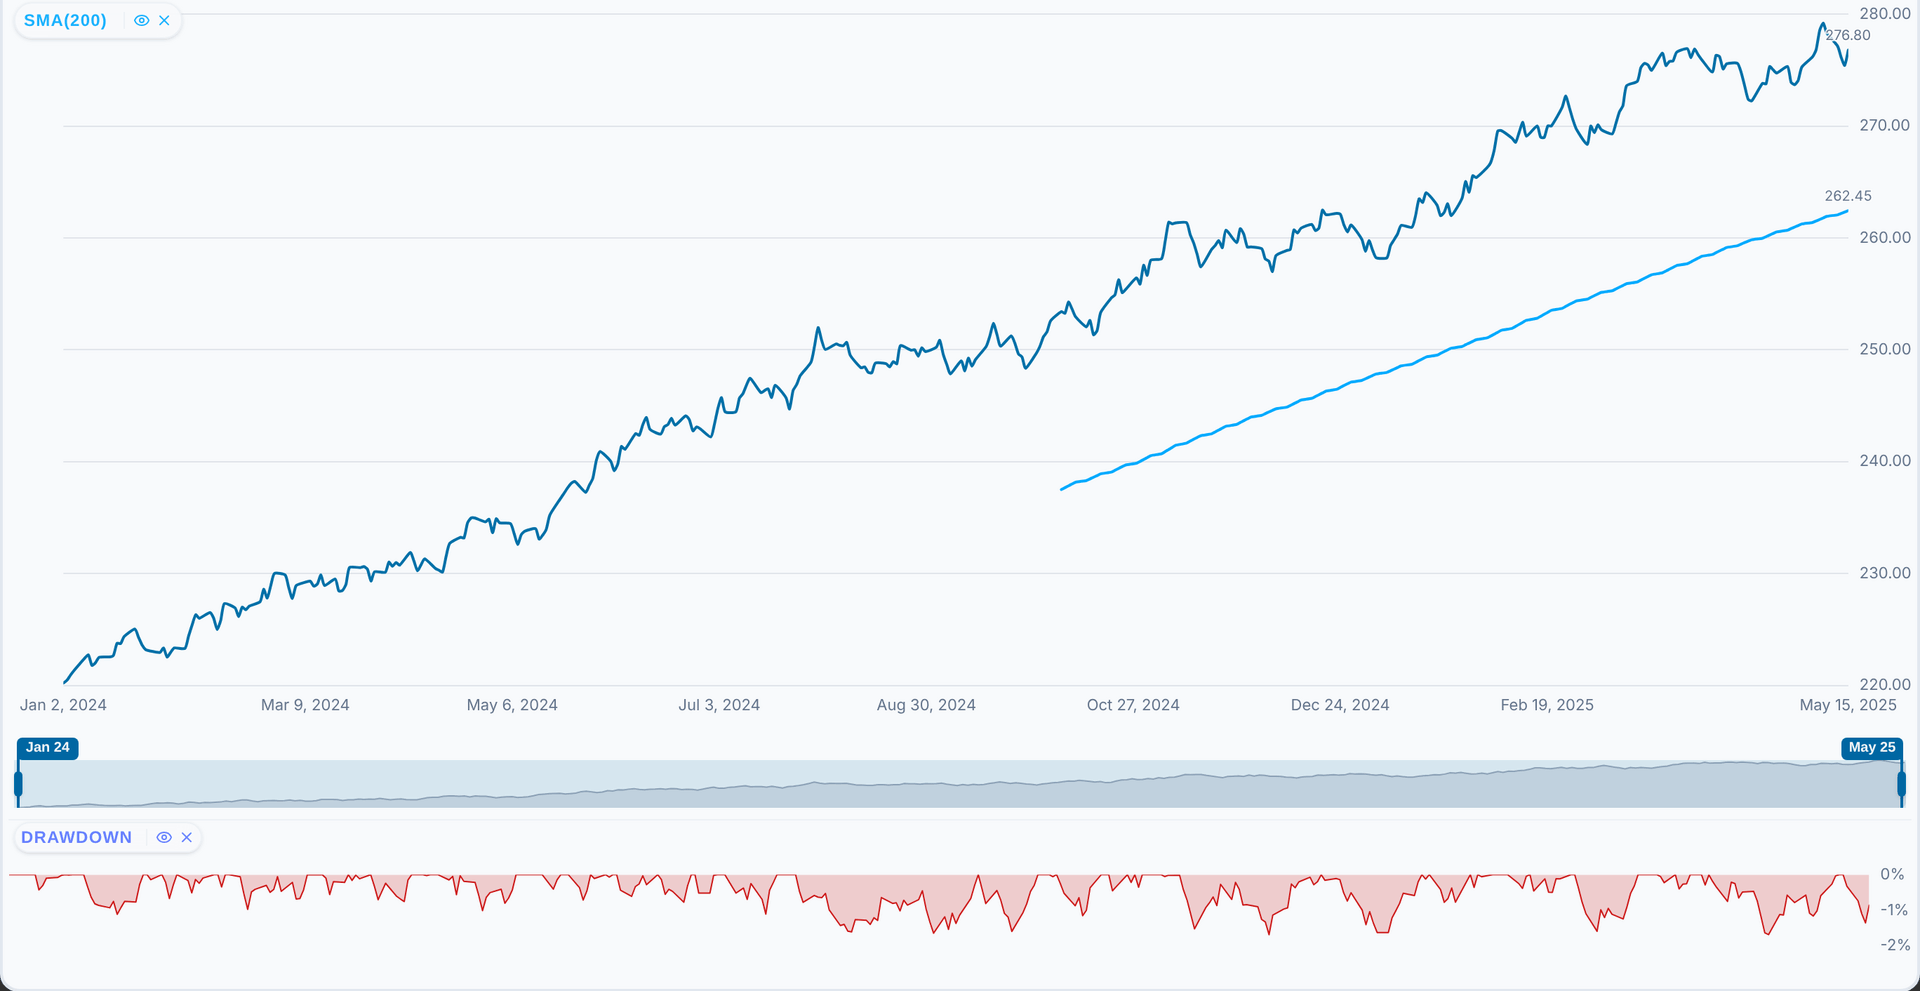
A stock's price chart now has a Drawdown indicator. Open the chart in full screen, pick it from Indicators, and a panel under the price shows how far each close stood below the highest close in the stretch you are looking at. Zoom in or drag and the peak moves with the chart. It sits at 0% on every new high and dips while the price is under water, so the deepest falls and the time each took to recover are there at a glance, and hovering tags the drawdown on that day. It comes with every plan.
Your portfolio's performance chart has a Drawdown switch in its header, next to the mode picker. Turn it on and the chart shows the drawdown of whatever it was drawing, and of your benchmark beside it:
- TWR falls as a percentage of its best, unmoved by deposits and withdrawals.
- Simple Return and Unrealized Return fall in points from their best return.
- Absolute Value shows the money given back from your best gains, so a withdrawal never reads as a loss.
Each period button measures from its own start, and pointing at a position in the doughnut shows that position's drawdown.