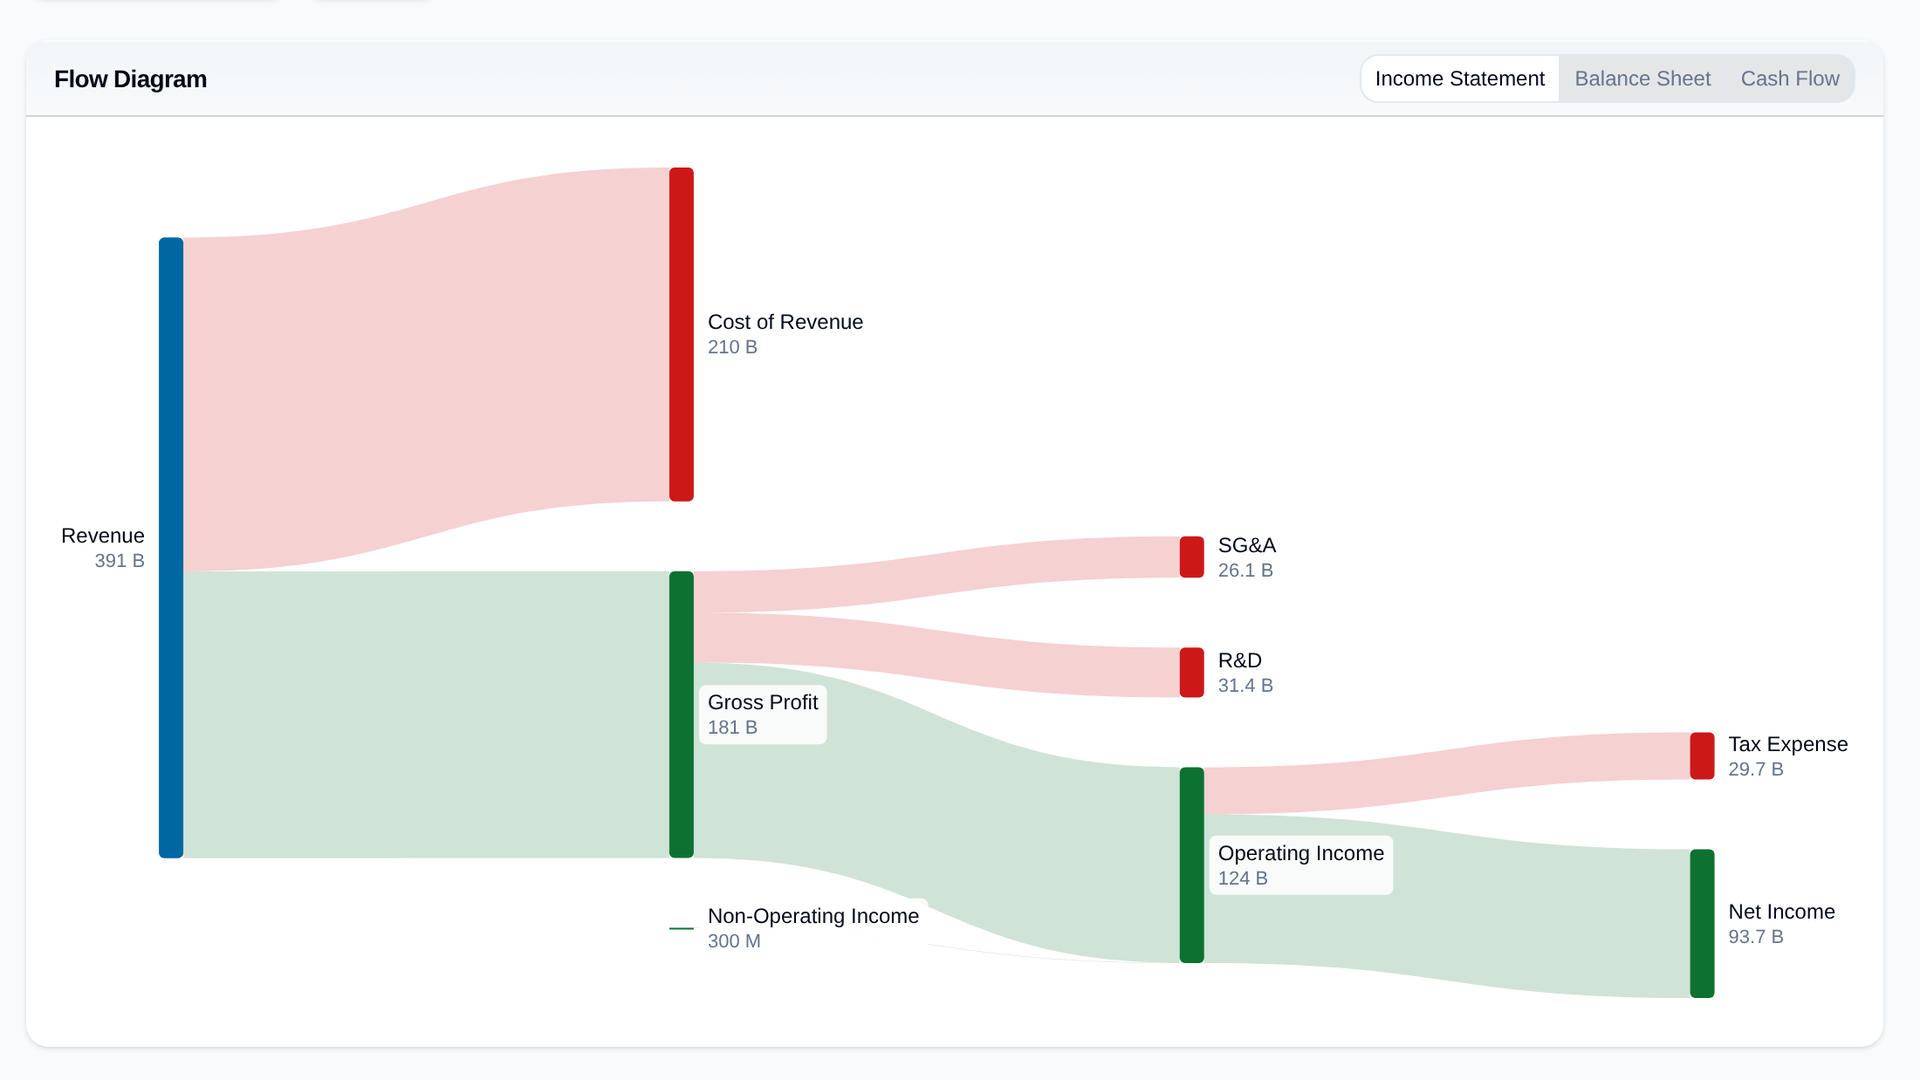
A flow diagram turns a financial statement into a picture you can read in a few seconds. Revenue comes in on the left and splits into what it costs to make, what is spent running the company, what goes in tax, and what is left as profit. The width of each stream is its share of the total.
There is one for each statement. The income statement follows revenue down to net income. The balance sheet shows what the company owns and how it is paid for. The cash flow shows where the cash came from and where it went.
They are drawn from scratch now, so labels never overlap or get cut off, and they follow your light or dark theme. Point at any block or stream to light up everything it touches, with its value and its share of revenue or of total assets. Pick the year or the quarter at the top.
Flow diagrams were in beta and are now open to every plan. You'll find them in Financial Data → Flow diagrams on any stock.