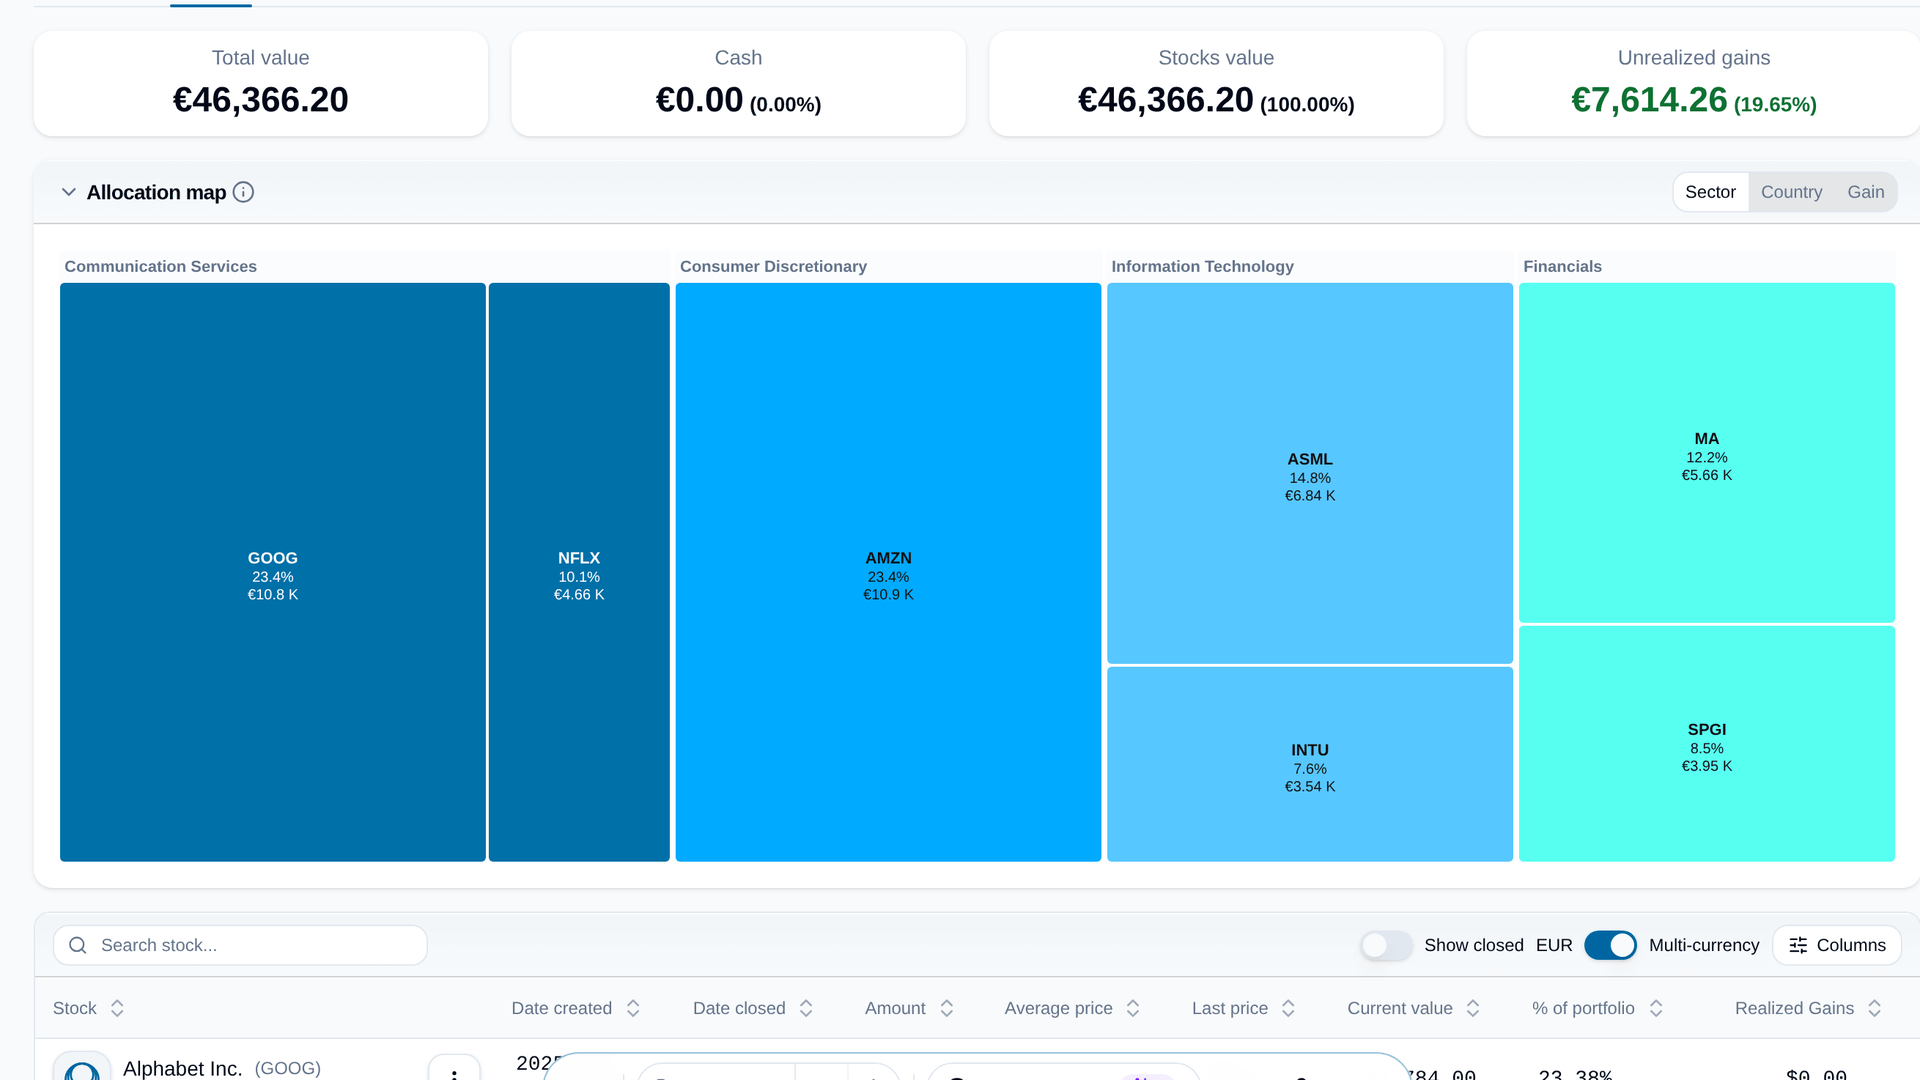
Your portfolio's Positions tab opens with an allocation map. Every holding is a tile sized by its weight, so you can see in a glance where your money actually is. Switch what the tiles show:
- Sector or Country, coloured by group, with each tile's weight and value.
- Gain, green or red by how much each holding is up or down, still grouped by sector.
Point at a tile for the stock's preview card, click it to open the stock. Fold the map away if you just want the table.
Your trades also show up where the price is. On a stock's price chart, every buy and sell you made is pinned to the line, with a ▲ for buys and a ▼ for sells, and a dashed line with your average price across the shares you still hold. The My trades switch above the chart turns them off.
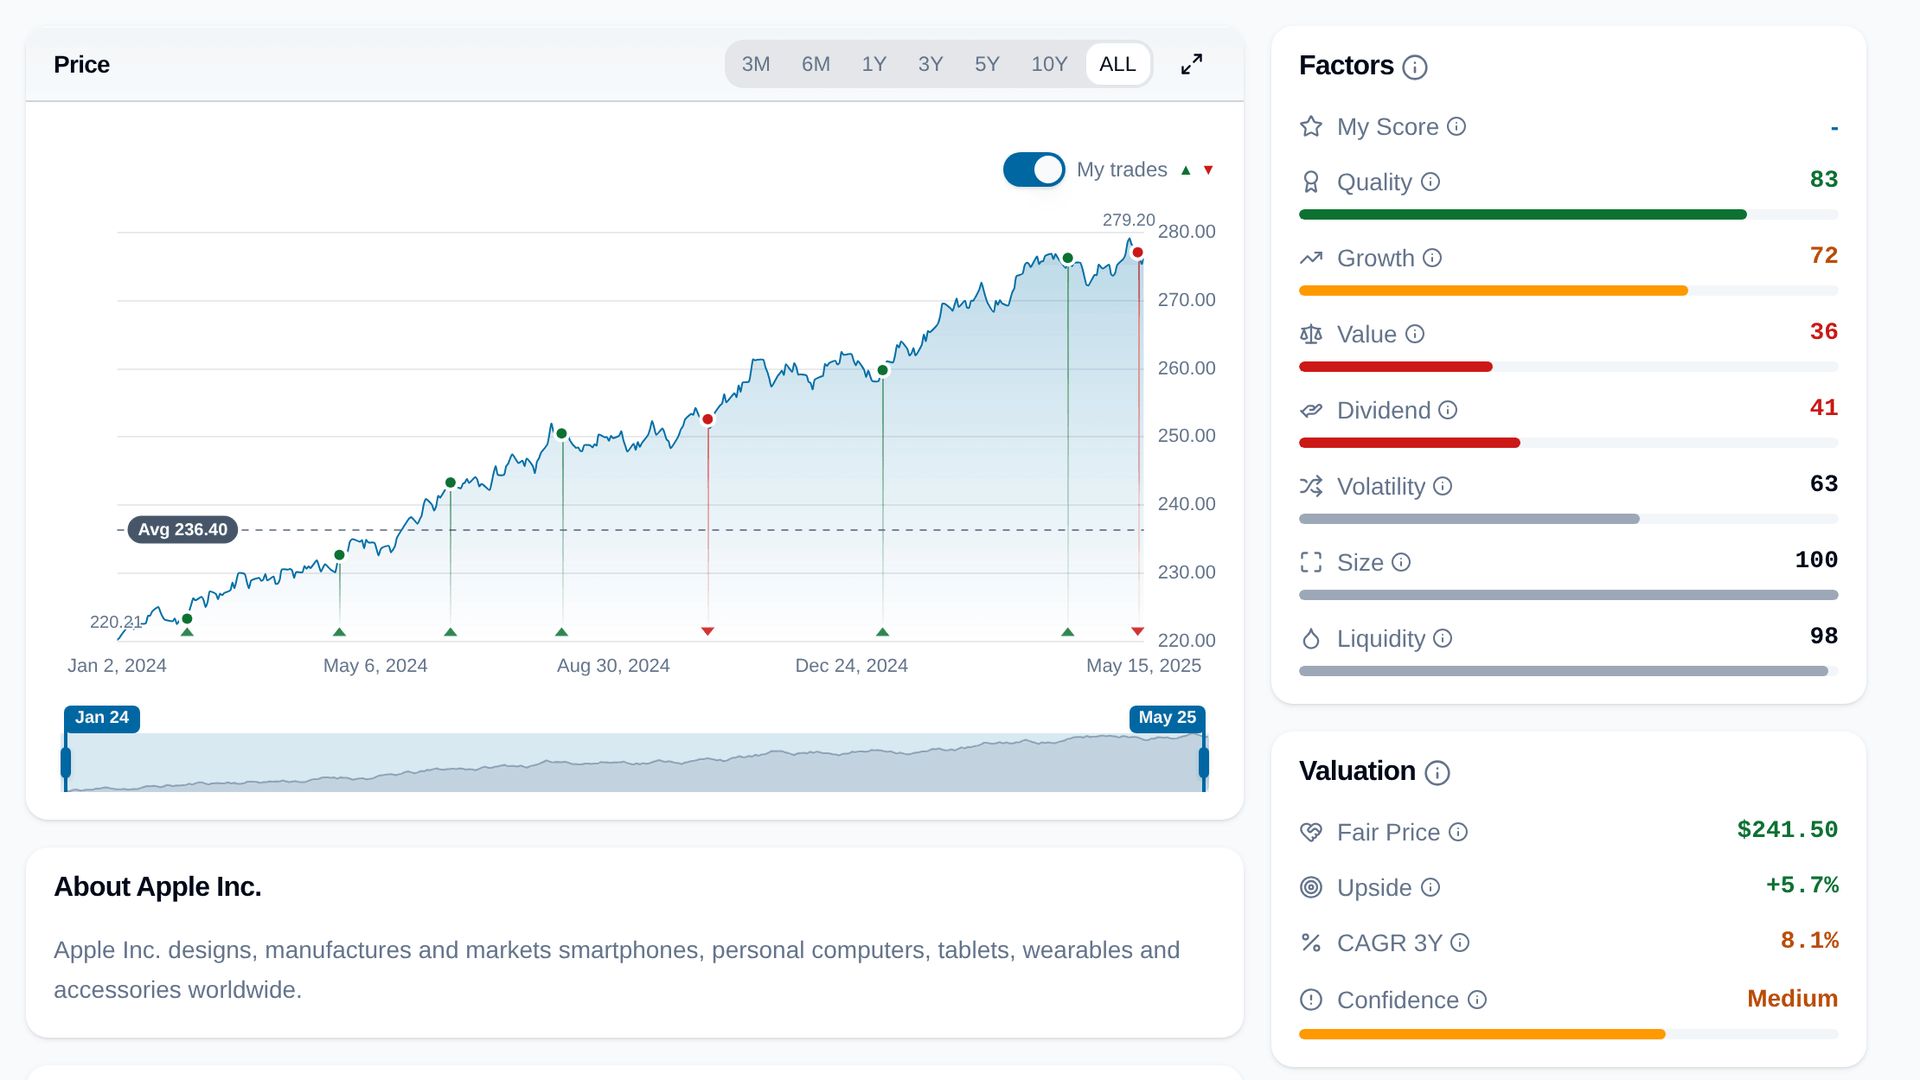
Open a holding's transactions in your portfolio and it starts with the same chart, zoomed to the time you've owned it.