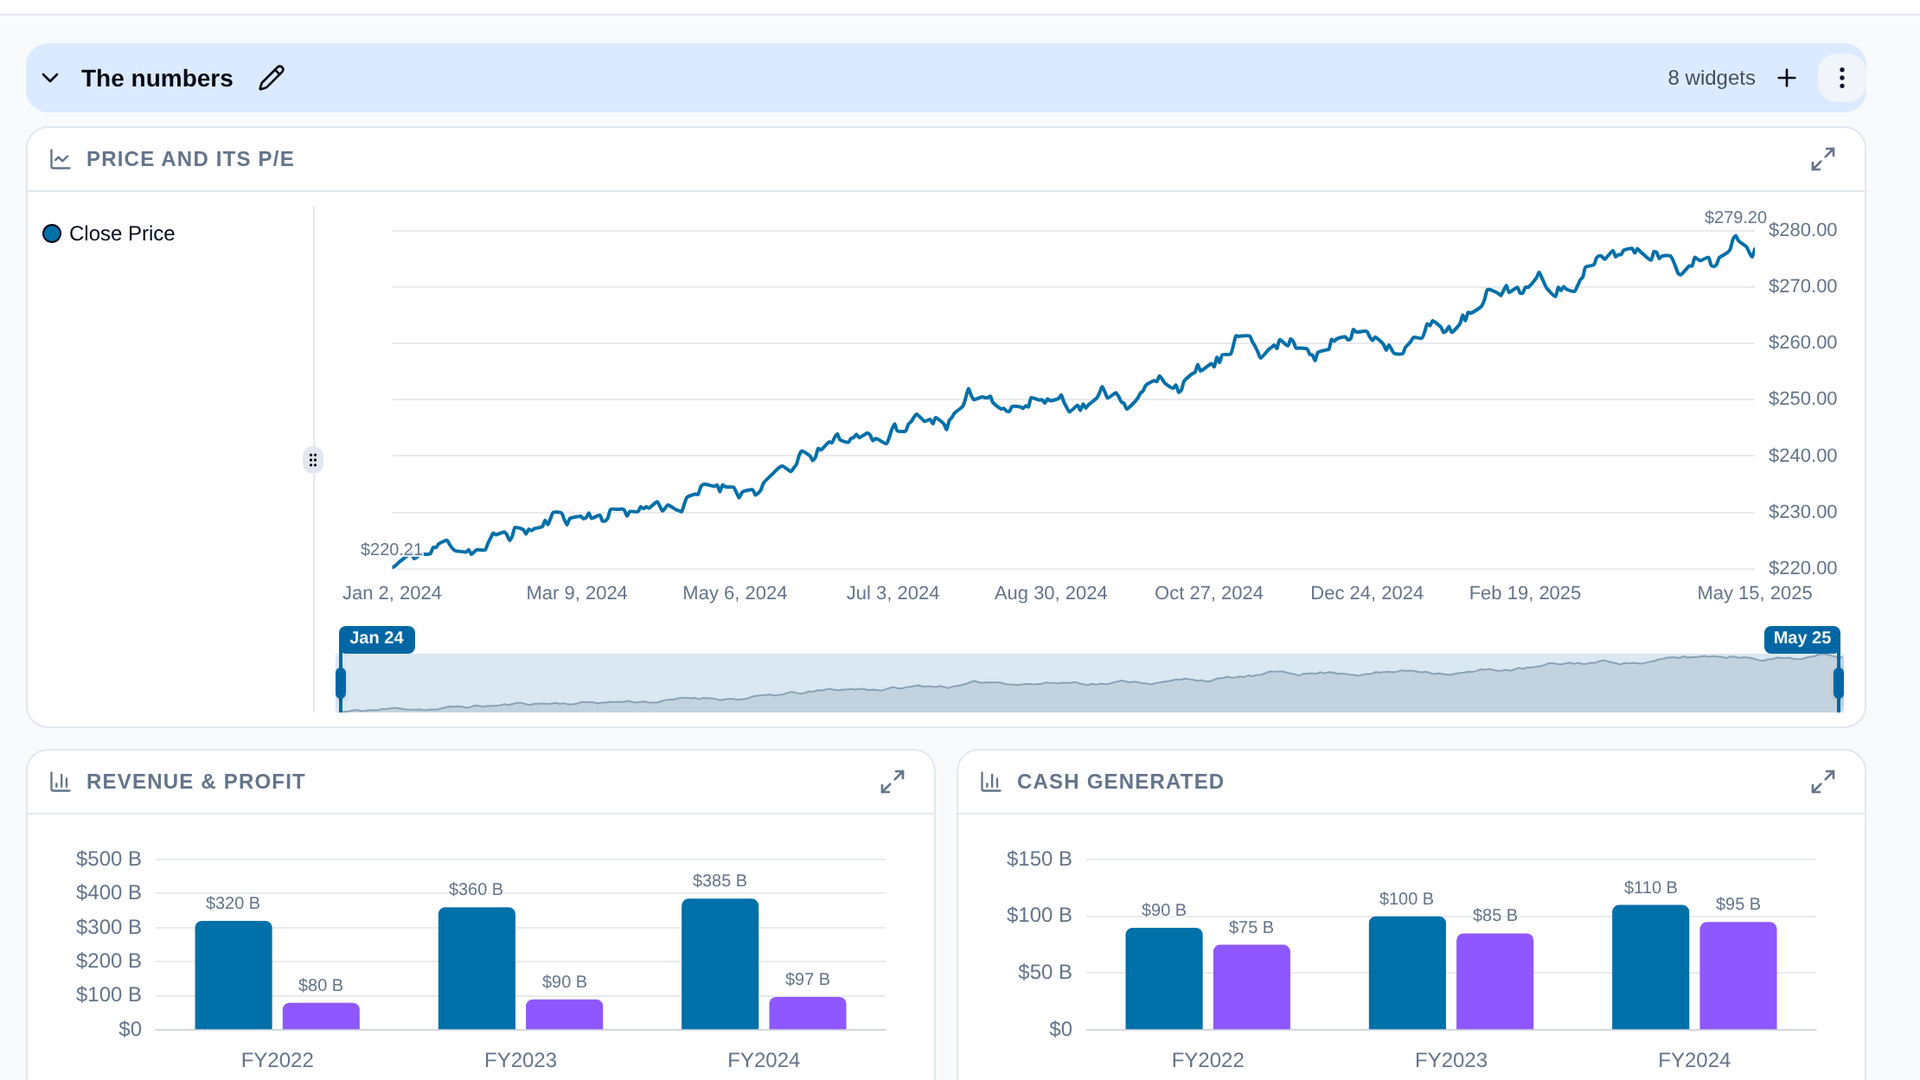
Every stock has a Dashboard section now: a page of tiles you arrange yourself, with the price, the financials, the multiples and the figures you always end up checking, side by side.
You don't have to start from an empty page. Pick one of eight templates, each built around one question an investor actually asks: First look, Quality check, Growth, Valuation, Dividend income, Capital allocation, Earnings season and Investment thesis. Each opens with the three or four figures the question turns on, then the charts that are the evidence.
From there it's yours. Add tiles from the Add button, resize and drag them, group them into sections, and open any chart full screen. The financials tiles show their growth rate over the bars, like the charts on the stock page. Save several dashboards and switch between them from the bar at the bottom.
The same dashboard works for any stock: build it once on one company and open it on the next.
Dashboards are in beta. Join the beta to try them.